How to Analyze Single-cell and Spatial Sequencing Data
Secondary Analysis Pipelines for Single-cell and Spatial Analysis

Secondary Analysis Steps for Single-cell and Spatial Ultima Sequencing Data
Trimming
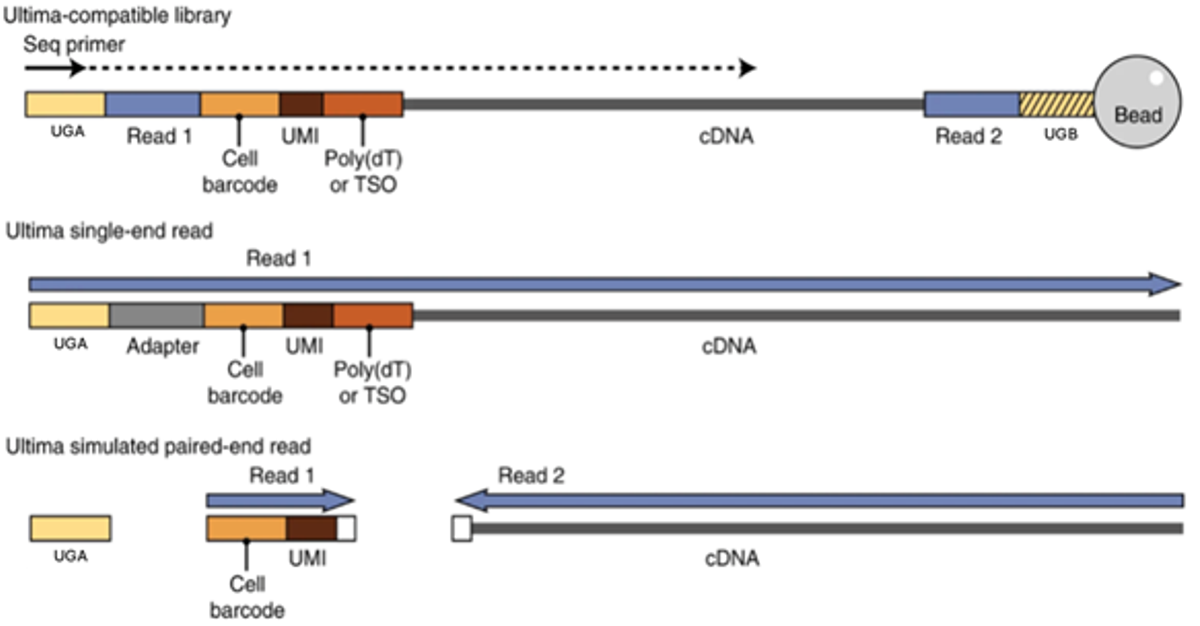
The Ultima Trimmer software tool divides each read into segments, trimming Ultima adapter sequence and any constant sequence (sequence left from library conversion, TSO or poly(dT) regions, or linker regions between cell barcodes). The Ultima barcode, cell barcode(s), UMIs, and insert regions are kept for downstream processing.
Alignment and Tagging
Reads are tagged (Ultima barcode, cell barcode(s), UMIs, and insert)
Demultiplexing
Reads are sorted, per sample, into folders based on Ultima barcodes.
Sample QC
A QC file labeled “<<run filename>>._scRNA.applicationQC.html” is generated.
File Output
Read data is output as a simulated paired-end FASTQ file tailored for input into each vendor’s specific downstream analysis platform.
Creation of Pseudo Paired End Output Files
Supported single cell and spatial assays run on the UG 100 sequencing platform will output files structured for direct input into downstream analysis tools specific for supported assay preparation kits. Processing includes trimming, sorting, and tagging the various library components (cell barcodes, UMI, conserved regions, etc.). Read structures determined by Ultima’s single-ended sequencing chemistry are then divided to produce simulated paired-end FASTQ files that contain information expected by the specific analysis tools designed by the assay providers. The figure below outlines this process for an example 3’ or 5’ single cell gene expression library

